Microburbs flags flood exposure on our property and suburb reports, matched to councils' own flood maps. A home the standard data calls safe can still sit where flooding is mapped, so check the place before you make an offer. Brisbane is newly mapped from Brisbane City Council's own flood-awareness data, and we are building that read into the Brisbane reports now.
Property portal, agent or proptech? License the flood data →
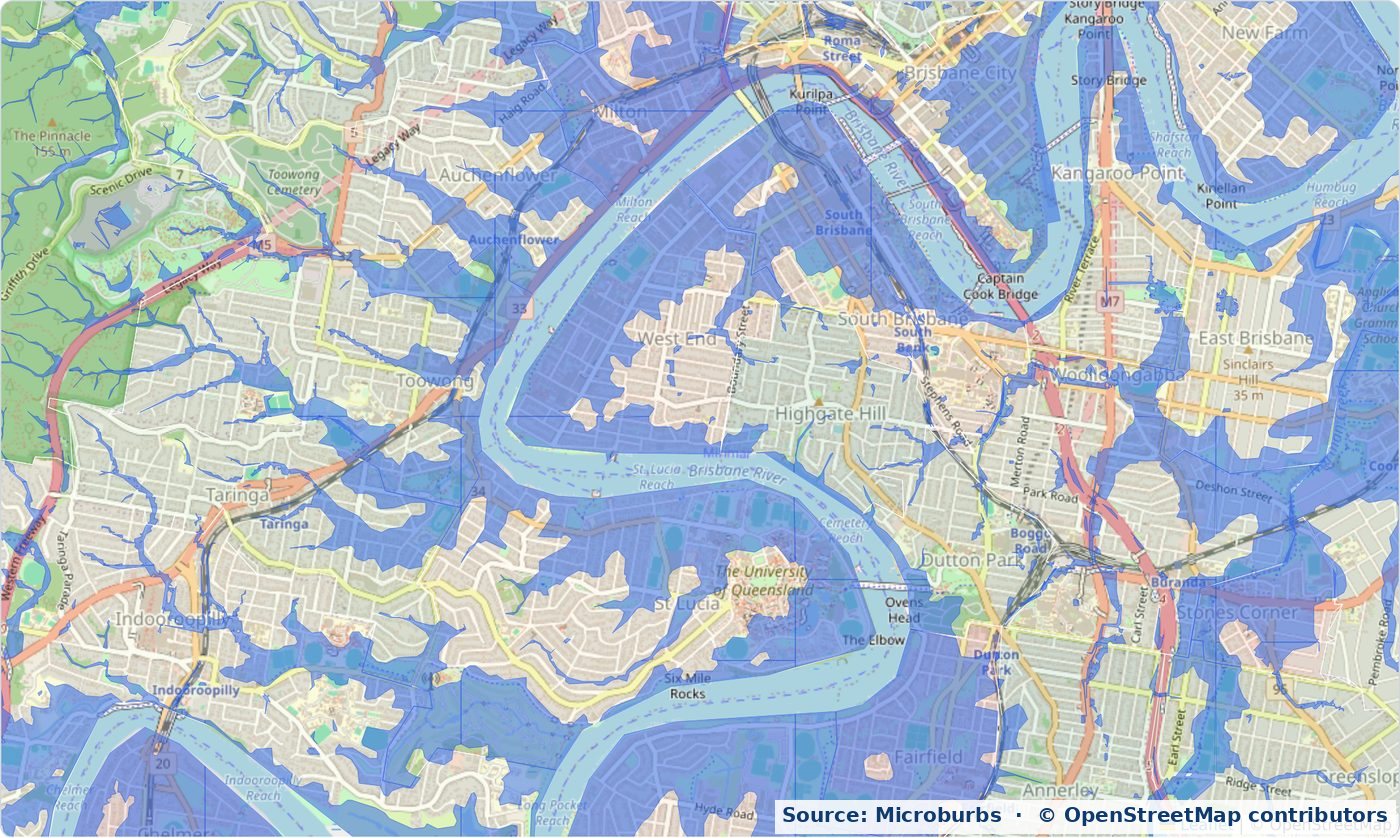
We match government flood-planning maps to properties and are rolling the result into our reports, so the flood picture sits next to the price, the growth and the rest of what you check. The flood flag is live across regional Queensland and parts of New South Wales today. The capital cities are rolling out now, starting with Brisbane, which we have just mapped from the Council's own data.
A count of flagged addresses is not the same as coverage. A low count can mean an area has not been assessed yet, not that it is safe. That is exactly what we found in Brisbane, where the standard data returned almost nothing for a city that floods. So we tell you where we have checked, and where we have not.
Coverage is strongest in regional Queensland, where the rivers flood. In New South Wales, the Northern Rivers around Lismore are covered, while the Hawkesbury floodplain around Windsor is not yet. No other state is covered yet. The capital cities are the next step, and Brisbane is the first, read street by street from the Council's own map, as the picture above shows.
Flood exposure shapes what you pay for insurance, how carefully a lender looks at the loan, and what the home is worth when you come to sell. The catch is that a property can read "no flood risk" in the standard data and still sit deep inside the area a council maps as flood-prone. The Council flood-awareness area shows where flooding is possible, not how likely or how deep, so treat it as a prompt: if a place sits inside it, check the Council's FloodWise report for the modelled flood likelihoods and flood levels before you price cover, negotiate or bid.
Almost every street sits inside the area the Council maps as flood-prone.
The peninsula sits in the river bend, with streets deep inside the flood area.
Higher ground, where most streets sit clear of the Council flood area.
Open its Microburbs property report or suburb report. The flood read sits alongside the price, growth and lifestyle picture, so you weigh it up in one place before you make an offer. For the fine detail on a single Brisbane property, Brisbane City Council's FloodWise report has the street-level detail, including the modelled flood likelihoods and flood levels.
Before you sign: in Queensland the risk in the property usually passes to you at 5pm on the first business day after the contract date. Get your flood insurance quotes before then, not after.
Property portal, agent or proptech? Talk to us about licensing our flood data →
Honest status: the flood flag inside property reports is not yet reliable for Brisbane or the wider South East Queensland metro (Brisbane, Gold Coast, Ipswich, Logan, Moreton Bay, the Sunshine Coast). We are correcting it now from the same Council data the map above uses. In New South Wales the flag is not yet reliable for the Hawkesbury floodplain around Windsor either, though the Northern Rivers around Lismore are covered. Until we confirm a place, use the map above and the relevant council flood report, not the report's flood section.
Flood areas from government flood-planning data, including Brisbane City Council's Flood Awareness Extents (updated September 2025, coverage October 2024, checked current as at July 2026), used under CC BY 4.0. Where we have checked is stated above, and we update it as each area is assessed.
