Why is the Australian Census Important?

The census is a national survey that is conducted by the government to collect detailed information on the population of a country. The census provides a wealth of important data on demographics, education, employment, and housing, which is used by government, businesses, researchers, and community organizations to inform decision-making and better understand the needs and characteristics of the population. This is immensely valuable, as a report by Lateral Economics in 2019 found that for every $1 spent on the census $6 was added to the Australian economy.

But why is the census important? Here are five reasons why the census is a valuable and indispensable tool for understanding the population and informing decision-making.

  1. The census provides a complete picture of the population. The census is designed to collect data on every member of the population, which means that it provides a comprehensive and detailed picture of the population and its characteristics. This is in contrast to other data sources that may only collect data on a sample of the population, which can introduce sampling errors and bias.
  2. The census collects detailed information on the population. The census collects a wide range of information on the population, including demographic, social, and economic characteristics. This information is collected using standardized definitions and classifications, which makes it possible to compare data over time and across different population groups.
  3. The census is conducted using rigorous methodologies and quality checks. The census is conducted using standardized protocols and trained enumerators, which helps to ensure the accuracy and reliability of the data. Additionally, the data is subject to quality checks to identify and correct any errors or inconsistencies. This high quality of the data makes it a valuable resource for informing decision-making.
  4. The census data is used in many different ways. The data collected in the census is used by government, businesses, researchers, and community organizations for a wide range of purposes. For example, the data can be used to inform decisions on issues such as infrastructure and services, to understand the needs and characteristics of the population and to monitor and evaluate the effectiveness of policies and programs. The data is also used by researchers to study trends and patterns in the population, and by businesses to identify opportunities and make informed decisions.
  5. The census helps to ensure that the population is represented and accounted for. The census provides a way for every member of the population to be counted and included in the data, which is important for ensuring that the needs and characteristics of the population are understood and taken into account. The census also helps to ensure that the population is represented in decision-making, by providing data on the distribution and characteristics of the population.

In conclusion, the census is a valuable and indispensable tool for understanding the population and informing decision-making. Its complete coverage, detailed information, high quality, and wide range of uses make it a valuable resource for government, businesses, researchers, and community organizations. The census is important for ensuring that the population is represented and accounted for, and for providing the data needed to make informed decisions on issues that affect the population.
What is the Australian Census?

If you were in Australia last year, then you may remember participating in the 2021 census. The census is a national survey conducted by the Australian Bureau of Statistics (ABS) every five years, and it is an important tool for understanding and planning for the needs of the Australian community.

The 2021 census was held on the night of Tuesday, 10th of August 2021, and it provided a valuable snapshot of the Australian population at that time. The information collected in the census is now being used by governments, businesses, and individuals to make important decisions about the distribution of services and infrastructure across the country.

How the Census is Used

  • Governments use the census data to help plan and fund services and infrastructure. For example, if the census shows that a particular area has a high number of young families, the government may invest in additional schools and childcare facilities to meet the needs of that community.
  • Businesses use the census data to make informed decisions about where to locate their operations. For example, if the census shows that a particular area has a large number of potential customers with a high disposable income, a retailer may choose to open a store in that area.
  • Researchers use the census data to study trends and patterns in the population. For example, a researcher studying the aging population may use census data to identify trends in the number and demographics of older Australians.
  • Individuals use the census data to inform their own decision-making. For example, someone looking to buy a house in a particular area may use census data to learn about the local schools, employment opportunities, and other factors that may be important to them.

Overall, the census provides a wealth of valuable information that is used by a wide range of organizations and individuals to make important decisions. It is a crucial tool for understanding and planning for the needs of the Australian community.

How the Census was Completed

In 2021, most households were able to complete the census online, which made the process more convenient and efficient. Households that were unable to complete the census online were visited by ABS staff, who provided assistance and collected the necessary information in person.

Confidentiality of the Census

The ABS takes the confidentiality of the information collected in the census very seriously, and all personal information is protected by law. The ABS is committed to ensuring that the census is conducted accurately and efficiently, and it works closely with the Australian government and other organizations to ensure that the census is a success.

Next Time

The next census will be held in 2026, so mark your calendars and be ready to participate. The census is a valuable tool for understanding and planning for the needs of the Australian community, and your participation is crucial to its success.

The Best Thing to do For Your Child is Move

Key Facts:

  1. Children who moved to a better area earned 30% more than their counterparts
  2. Children learn and emulate a significant amount from their environment outside the home
  3. Good suburbs create virtuous cycles, improving a child’s prospects

What’s Going On?

A study out of Harvard has demonstrated how 50-70% of a child’s success is due to where they were raised, not how they were raised. It is not about living in a house with lots of books. It’s about living in an area with lots of bookstores. If you want to raise an inventor, move to an area where there are more inventors. 

When growing up you are heavily influenced by your family. Yet, they are not the only influence. Children will always look beyond you, to their local environment to learn and emulate. It is not just their peers at school, although they are very significant. It is the type of conversation that is heard at the local cafe. The people they see commuting with them and the type of people involved in the community.

A Tale of Two Children 

Take two children. Both grow up in educated, well off, loving families. The difference is that one grows up in a rougher area of town and the other in a much nicer suburb.

What happens in the nice suburb?

The child in the nicer area is constantly exposed to people who are successful. They consistently see what is possible to accomplish in life. At school, the teachers explicitly and implicitly have higher expectations for the students. The conversation overheard while walking from the bus stop is different. The walk and local environment is nicer and healthier. They are treated like they will be a leader and like they will be successful. 

What happens in the rougher suburb?

It is a different tale for the child from the rougher suburb. They are exposed to greater stress due to fears of perceived or actual threats of crime and violence. This type of stress is documented to have negative impacts on cognitive health. They are consistently, implicitly and explicitly told by the world around them that less is expected from them. At school, lower expectations lead to less challenging work, pushing their abilities less. The community is less welcoming and cohesive. In the nicer area the community helps in times of need and provides immense aid in the future in the form of networking. 

The bigger picture

It is not difficult to see how these different areas will impact these children’s futures.  This is a simple picture. Even so, it demonstrates how the environment exposes children to tons of information that shapes the kind of person they become. 

Proof!

The Setup

This is not just a theory but has been proven in experiments. One of the largest experiments conducted was by the US government. In 1994 it began an experiment on 4,500 low income families from around the nation. These families were all very similar in education, health and demographics. A significant portion was moved to low poverty areas, while the rest did not move. The results would compare those who moved to those who did not.

Results

The differences in outcomes from this point on had to be attributed to the area they moved to. Their location was the only real difference between the groups. 

The results were significant, but not for everyone. Moving did not have much of an impact on the adults, they were effectively set in their ways. However, it had a big impact on young children (under 13). Because of their move, they were both mentally and physically healthier and by their 20s were earning 30% more than those who did not move. This is despite the fact that their parents were doing just as badly as those parents who had not moved. 

This has been supported by ongoing research. For example, it has been found that for every year a child lives in a better suburb their outcomes align increasingly with what is expected from that area at a rate of 4%. 

The Takeaway

The determinants of a developing child’s interests, abilities and character are complicated. Where you choose to raise your kids does not solely determine their future. The type of person you are, genetics and a million different things determine the future of your child. However, there is a strong base of research to demonstrate the kind of area where your kid is raised does play an essential role in their future. 

Microburbs 2022 Refresh: We’re Hiring Analysts, Editors, Online Marketers and PR people!

Yes, we are building a new Microburbs which is way richer in data and insights and of course up-to-date for 2022. It will be a big leap forward in the number and quality of useful, actionable reports available for free for ordinary Australians.

Consider this an official invitation to apply to join our small team. We’re looking for people with great skills.

We believe in empowering Australians will all the data they need to make all kinds of location based decisions.

About you:

  • Curious, analytical mindset
  • For the analyst role, intermediate+ level in python and pandas
  • For the writer role, excellent written English.

Editor/Writer role:

  • Writing engaging articles that get shared on social media
  • Getting coverage of our work in the media, both mainstream and online.
  • Editing site content

Analyst role:

  • Analysis of Australian lifestyle, demographics, housing and local economies
  • Evaluation of data sources
  • Data transformation using pandas
  • For the writer, content writing and proofing

Not essential but familiarity with any of these will help:

  • Australian public data (eg data.gov.au)
  • The Australian urban landscape, real estate market
  • Internet marketing

Flexible working conditions including Work From Anywhere, part/full time depending on your schedule. We’re hiring a variety of skill levels, so remuneration will be relative to experience.

Because we’re a very small team, we will can adapt the role to your skills and interests.

To apply, please send your resume along with some the best examples of your work to +614 14 183 210 or Luke Metcalfe’s LinkedIn.

Coalition loses rich, migrants. Labor gains miners. Far right gains Middle Easterners.

A Microburbs analysis: I analysed every polling booth’s vote in yesterday’s federal election to find high resolution insights on where Australian politics is heading.

Most of the commentary we see so far is on an electorate level, but there are far more polling booths than electorates, so we can much more confident about analysis at this level.

Coalition continues to trend poor

The big takeout is we’re seeing a continuation of the trend in the federal last election where the Coalition’s support base is shifting towards poorer, less skilled, the less educated people born in Australia.

Increasingly the Coalition represent the Australian-born working class, as independents deprive them of their previous base of rich, professionals. Labor is losing social conservatives seemingly to the minor right wing parties.

The top 20% of polling booths with the most international citizens, swung against the Coalition nearly 12%, while the most polling booths with a majority third generation ancestry only suffered a similar swing against them to what Labor endured nationally.

Rich, educated professionals swung 11-12% against The Coalition, while the country’s working poor swung only 3-4% against them.

So 20% of polling booths with paying the lowest rent, earning the lowest incomes and with the least skills swung 2-4% against the government, while the fifth of Australia’s polling booths where such people are rarest saw a 10-12% collapse in LNP primary vote.

Labor wins back miners

The best predictor of a swing to Labor were miners. The 665 polling booths in the country who had over 5% of the population in mining, Labor enjoyed an average swing to them of 1.5% while the rest of the country swung against them 3.5%.

Minor right wing parties grow among Middle Easterners

Perhaps due to anti-vaccination, anti-lockdown sentiments and common social conservatism, the minor right wing parties have surged amongst people of Arabic and Serbian background. Where the polling booth is in the top 5% of these demographics, such parties more than doubled their swing.

There is a matching swing against Labor in these same places.

There will be plenty more demographic analysis to come with the coming reboot of Microburbs for 2022.

COVID 19: Is Australia really different?

Sociodemographics and COVID-19

Is Australia really different from Italy and Spain?

Australia has thus far managed to keep its rate of new infections related to COVID-19 low and its total number of issued tests high relative to other Western developed nations. Watching the numbers climb amidst the rest of the world, many have growing concerns, wondering if the current rate of infections will continue to climb for the next several months in Australia or if the curve will level sooner. Government Deputy Chief Medical Officer Professor Paul Kelly issued a public statement expressing his profound faith in the Australian government moving forward, stating, “We are not Italy, Iran, or Spain…we have reason to be confident we will keep ahead of the curve.” He goes on to list government efforts alongside common sense health guidance, leaving many to wonder if this is an unfounded sense of exceptionalism or if there really is something unique about Australia compared to other countries. 

As it turns out, there are significant differences between European nations such as Spain and Italy, who have been hit particularly hard by COVID-19, and Australia. But there are also similarities. Thorough analysis of these various social, spatial, and demographic factors which predate COVID-19 could offer valuable insight into its possible spread. It is only through first understanding this framework that we are able to accurately predict what is to come and safeguard against it.

Proxemics: The Study of Personal Space

Southern Europeans consistently have lower personal space requirements than average, rivaled only by Eastern Europeans and Latin Americans. Though this varies based on the individual, on average Italians and Spaniards in social situations are comfortable standing 90cm apart from strangers and around 70cm from acquaintances. When speaking with close family and friends, Spaniards were comfortable with slightly under 60cm where Italians were comfortable with as little as 40cm. The result of these social conventions is a greatly reduced proximity well below the 1.8 meters of social distance recommended  to prevent the spread of coronavirus. 

In Italy, it is considered rude to position oneself towards the door rather than towards other individuals when in public, even in close proximity situations such as elevators. In both cultures, there was an overall tendency towards physical touch as an expression of friendliness or politeness. Reaching out to touch a friend’s arm in conversation is seen as a sign of friendliness. A kiss on both cheeks is considered to be a simple polite greeting. 

Both Spain and Italy are considered contact cultures, which embrace a high level of social engagement and reduced personal space restrictions. By contrast, Australia is a non contact culture, in which a much larger amount of personal space is considered the norm, even between close friends or family. 

When considering whether Australia will experience greater numbers of outbreaks in the coming months similar to what Italy or Spain has experienced, it is important to note that the behavioural adaptations Australians would have to make to comply with COVID-19 safety guidelines are much less drastic than people in contact cultures such as Italy or Spain. Behaviour that is considered basic manners in these places unfortunately pose a risk, as COVID-19 is primarily spread through respiratory droplets as a result of sneezing, coughing, speaking and even breathing. 

Population Density

While both Italy and Spain have larger overall populations, Australia has more major cities with over one million people residing there. The national population distribution in Australia is very stratified, with the majority of its population residing in urban areas but a large portion residing in rural areas. As COVID-19 seems to have spread more rapidly in densely populated areas, this may present a problem for the slight majority of Australia’s population.

While Australia is more heavily stratified in its population distribution than either Italy or Spain, this difference pales in comparison to the radically different land distributions of Australia compared to either Spain or Italy. The national area distribution is a measure of how the landmass of the country is used. Australia is dominated by rural land, leaving its population congregated into a smaller overall area than either Spain or Italy.  

Both Italy and Spain feature a relatively even distribution of its population in either intermediate or urban areas located throughout the countries. In contrast, Australia features an extremely dense concentration of its population in various cities in the Southeast. Almost 50% of Australia’s total population is located in Sydney, Melbourne, or Brisbane. The most populous area of Australia extends between Melbourne and Sydney along the ocean. 

While the overall population density of Australia is extremely low at only three residents per km2 due to the vast amount of rural areas, its urban population density is around 400 residents per km2

In contrast, the overall population density of Italy is reported at 206 residents per km2, with an urban population density that varied widely from 376 (Bologna) to 2,279 (Naples) residents per km2

The overall population density of Spain was somewhere in the middle at 94 residents per km2, but with an extremely high population densities in major metropolitan areas such as Barcelona and Cádiz at 15,991 residents per km2 and 9,700 per km2, respectively.

All of this seems to suggest that there is indeed a dramatic difference between the most densely populated areas of Spain and Italy as compared to Australia. If one was to journey by car from Sydney to Melbourne, the trip would take roughly 875km, requiring the driver to pass through several small to medium sized cities, with only Albury boasting over 50,000 residents. In contrast, a trip from Madrid to Barcelona would take roughly 621km, bypassing Lleida (over 430,000 residents) and Guadalajara (over 258,000 residents) along the way. The journey from the major hubs of Italy, Rome and Milan, is shortest of all at 573km. Yet along the way the driver would pass Parma, Bologna, and FLorence, all with populations of over 190,000. So while Australia’s population is concentrated in the same region, there is a reduced overall chance of spreading infection between major population hubs. 

While it is true that COVID-19 has the capacity to infiltrate rural areas, its reach is limited should individuals follow safety guidelines. Within rural areas, engagement with others is much less frequent and outside of a few household tasks such as grocery shopping, refueling gasoline, and picking up prescriptions, it is not inevitable. Those in rural areas are accustomed to a certain degree of social isolation and already have a culture of self-sufficiency that lends well to the unique safety precautions surrounding the virus.

Furthermore, unlike both Italy and Spain, Australia is an isolated continent. This makes it more difficult to circumvent regulations which attempt to safeguard against international spread of the disease. 

Aging Population

For many years now, Italy has had difficulty dealing with an aging population. Compared to Australia or Spain, Italy has a significantly higher percentage of its population over sixty-five and up to 60% of its population is over forty years of age. 

In Italy, around 96% of all elderly people continue to live in their own homes, relying largely on relatives to care for them when needed. Significant portions of the elderly population lived in homes with their adult children, which some critics argued may be putting these elders at risk. The impact of this when it comes to COVID-19 are debatable, as the country has experienced a wave of deaths in its nursing homes despite relatively low uptake for these services. It is possible that family members, who are often not medical professionals, may not take the necessary precautions to prevent the spread of illness.

In Spain, a significant proportion of the population considered caring for elderly relatives to be a moral duty, especially amongst the older and conservative members of the population. Though there was a distinct difference in that Spanish elders preferred to remain in their own homes out of a sense of pride rather than move in with the family members caring for them. Last year, over two million Spanish elders lived alone and heavily valued their autonomy. 

By contrast, Australia has a highly developed home care programme available to elders alongside traditional nursing home programs. Australian elders are more likely to request informal assistance from their spouses or formal assistance from private commercial organisations or government entities than other family members. This indicated a less strong cultural trend to require familial involvement in the care of elders than either Spain or Italy.

Cultural Components

Both Spain and Italy place a high value on family embeddedness, demonstrated in a reluctance for young people to obtain their own places of residence well after they are financially able to do so. These cultures highly value a high level of engagement with family members, with an increased value placed on the extended family than in Australia. This is indicated by the high levels of young people up to twenty-nine who continue to live with their parents, in both Italy and Spain. Though slightly over half of young people continue to live at home in Australia, there is a much less pronounced cultural trend that encourages young adults to continue to live with family.

Both Spain and Italy had distinct emphasis on their food cultures, often gathering with large groups of family, friends, or coworkers to share meals. Both countries offered generous lunch breaks in the middle of the day to encourage workers to gather for an extended meal break or take a siesta at home. 

Australians have marginally higher levels of internet usage as compared to either Spaniards or Italians, which has continued to be the case in the midst of the pandemic. This could help fortify individuals in their attempts to social distance, as habitual social media usage will lend to a decreased disruption in their social lives. 

Ultimately, no country is immune to the impacts of COVID-19, which has been demonstrated by news reporting and the lived experiences of healthcare workers the world over. There are some shared risks between Italy, Spain, and Australia regarding urban areas which feature higher levels of population density. Studies based in Africa have shown that coastal areas with large populations carry a greater importation risk than their landlocked counterparts. 

Overall, the sociodemographic data available before the COVID-19 outbreak would seem to indicate that there are significant differences in social behavioural patterns, cultural components, and urban sprawl when comparing the three countries. While only time will tell when the curve will flatten, it would seem that there are several components unique to Australia which provide significant fortifications against the spread of the virus.

(datawrapper.de)


The World Bank: Population, total – Italy, Spain, Australia
Italy SpainAustralia
Total60,431,28346,723,74924,992,369

Worldometers
ItalySpainAustralia
Net population Density (perkm2)206943

World Population Review
cities > 1M100,000-1M10,000-100,000
Italy231892
Spain288770
Australia514375

OECD (% of total pop) in 2018
ItalySpainAustralia
Total population (million)60.44246.77324.993
Young population (<15)13.314.818.8
Working age population (15-64)6465.865.5
Elderly population (>65)22.6819.2915.66

WorldometersTotal casesNew Casestotal deathsnew deathstotal recoveredactive casesserious, crittot cases/1M popdeaths/1M poptotal teststests/1M pop
Italy1394221766926491952623693230629280712513349
Spain148,22014,79248,02185,4077,0693,170316355,5507,593
Australia60525028133189872372319,78412541

**Importation risk

(https://www.sciencedirect.com/science/article/pii/S0140673620304116?casa_token=efNXKIKXYrUAAAAA:Vp2yssOjnLFhcF7WLHfjiLDkluCLCvm9UQ6PH4jgivX_Xpyv6VQhU-zG2RIWrhFqRMPPxLky9Q)

Gilbert et. al

Preparedness and vulnerability of African countries against importation of COVID-19

(https://science.sciencemag.org/content/early/2020/03/05/science.aba9757.abstract?casa_token=9UaHvgd9noMAAAAA:XAJg29gCAD7whhK_ugymKFGsOSz_0u_D3RUP69YlfEmg4hMMLUbl5ZmUOZ6OH7qvUfkmImOGfIOz_A)

Chinazzi et. al

The effect of travel restrictions on the spread of the novel coronavirus outbreak

Australia total land: 7,692,024 km2

.7% urban

53,844 km2 urban area

Spain total land: 505,990 km2

14.4% urban

72,862 km2 urban area

Italy total land: 301,338 km2

24.6% urban

74,129 km2 urban area

Italy

(https://worldpopulationreview.com/countries/italy-population/cities/)

(https://www.thelocal.it/20200309/map-which-parts-of-italy-are-affected-by-coronavirus-outbreak)

(https://github.com/pcm-dpc/COVID-19/blob/master/schede-riepilogative/regioni/dpc-covid19-ita-scheda-regioni-20200408.pdf)

Spain

(https://worldpopulationreview.com/countries/spain-population/cities/)

Australia

(https://worldpopulationreview.com/countries/australia-population/cities/)

10% of population in rural towns


Sydney’s Babycino Belt: Family Friendly Suburbs That Haven’t Lost Their Cool

So you have kids, or are planning some. They need great schools and safe places to play,  but you want to keep the vitality of places you’ve lived in your younger, freer days. You’re not ready to move to a typical suburban place just yet. You may now feel the urge to share with your childless friends how little sleep you’re getting and still feel solidarity even though their sleeplessness was very much by choice.

Is it possible to have it all? Can kids and parents all be happy in the one place? Of course you can, but how much is it going to cost you? I’ve mined our Microburbs data to find out, and present my top picks:

5. Rushcutters Bay

More than just a place to jog past hundreds of yachts, Rushcutters Bay is our eastside representative of Sydney’s fringe.

This exclusive suburb is 5 minutes walk from uber hip Kings Cross combined with access to Sydney’s east. It’s a halfway mark between gentrifying hipness on the west to the elite lifestyle of Darling Point to its east. A midpoint between star performer private schools SCEGGS and Ascham (both top 1%).

Just be careful with the young ones as mediocre performance in day cares might make a nanny a good option.

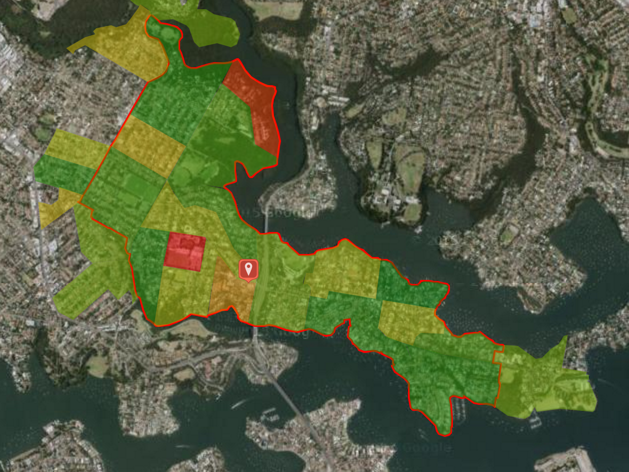
Family Score around Rushcutters Bay is shown here,  rising from middling (yellow) to high (green) in the east:

4. Bondi Beach

We’ve all been to Bondi and admired the brash culture of the East, where money meets backpackers, but have you considered raising a family there?

With a family score of 8 out of 10, your kids won’t want for surf and public gym equipment. Admittedly, Bondi Beach Public School doesn’t perform that great for its area with top 38% NAPLAN. But if you can afford to buy in Bondi, you may have the spare change to afford an excellent private school like Reddam House. For a mere $565,000 you could see your three children all the way through primary and high school. What price is too high for top 1% NAPLAN?

3. Neutral Bay

Our top performer north of the Bridge is Neutral Bay. For many it’s a drive-through suburb dominated by a single pub, but recent developments of small bars and funky cafes along Grosvenor St make Neutral Bay deserving of a second look.

It will not surprise many that Neutral Bay and St Mary’s public schools perform well. After all it’s an affluent area with parents who value their time so much, they only just live outside the city. But these schools perform really well – Netural Bay, St Mary’s Catholic and North Sydney boys and girls are all top 1%ers. Mind the day care costs though – they typically charge around $160 per day.

Also showing a strong performance are neighbouring Cammeray and Cremorne, which share their ample parks, playgrounds and sporting grounds.

2. Forest Lodge

Tucked away behind its more famous neighbour, Glebe, Forest Lodge is another suburb that resides at the top of our hip score list but still provides a very good lifestyle for families. With Forest Lodge in the top 10% for NAPLAN and St Brendans Catholic School at top 5%. Nearby Sydney Secondary college also performs well (top 8%).

4358974940_64bcb15229_b Unlike the Erskineville, Newtown, Camperdown troika, Forest Lodge stands alone at serving both families and hip people with neighbouring Glebe to its east serving hipsters and more spacious Annandale to its west providing for family.
1. Erskineville / Newtown / Camperdown

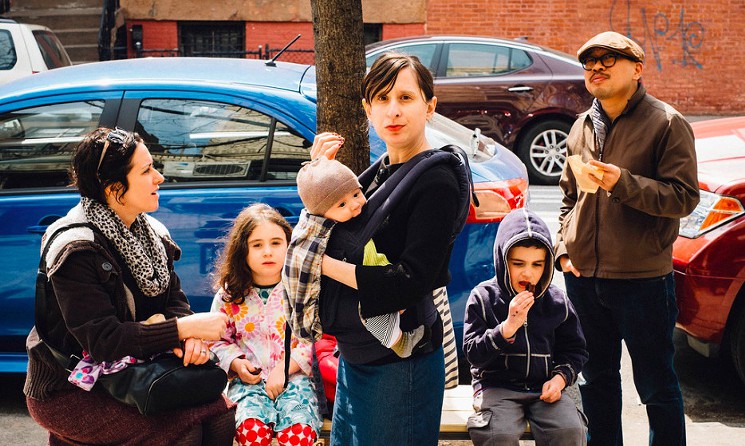
These neighbouring suburbs are all hip and serve families so well, we had to put them together for first place. Sydney’s Erskineville has a lively community with ample creative professionals, bountiful cafes and 20 art schools within 2km. Its dining options are also vast, courtesy of neighbouring Newtown. You could eat at a new Thai place every day for a fortnight.

hipsterparents1

Family score typically doesn’t accompany hip score but this sought after suburb is definitely an exception. Erskineville public school gets top 8% in NAPLAN.

It’s not so great in terms of tranquillity though, having 9 times Sydney’s average population density. For a bit of space, look the sprawling Sydney Park at its southern tip, which makes for an excellent respite to densely packed inner city living.

Our Official Top 20

Rank Suburb Family Score Hip Score Median House Price 2016
1 Erskineville 8.2 8.9 $1,315,000
2 Camperdown 8.4 8.7 $1,352,500
3 Bondi 8.6 8.5 $2,555,000
4 Newtown 8.1 8.9 $1,301,000
5 Forest Lodge 8.4 8.6 $1,680,000
6 Centennial Park 8.9 8.1 $2,650,000
7 Wollstonecraft 9.3 7.7 $3,537,500
8 Neutral Bay 9.5 7.5 $1,750,000
9 Queenscliff 9.2 7.7 $1,610,000
10 Cammeray 9.7 7.1 $4,050,500
11 Stanmore 8.7 8.1 $1,570,500
12 Waverton 9.4 7.5 $4,750,000
13 Paddington 8.6 8.2 $1,700,000
14 Fairlight 9.6 7.2 $1,583,500
15 Bondi Beach 8 8.8 $2,990,000
16 Newtown 7.8 9 $1,301,000
17 Cremorne 9.5 7.3 $1,947,000
18 Rushcutters Bay 7.8 9 $2,562,500
19 Bronte 9.1 7.7 $3,010,000
20 North Bondi 8.9 7.9 $2,550,000

Microburbs Report – Family Score

The Family Score panel of each microburbs report includes the performance of all classes of local schools, along with catchment boundaries and travel times. For a limited time, we’re offering a comprehensive family scores report for all Australian suburbs, which we can send you instantly:

Oh no...This form doesn't exist. Head back to the manage forms page and select a different form.

For press enquiries about this article, please call Microburbs Founder Luke Metcalfe on 0414 183 210.

Panama Papers Release Reveals Top Tax Avoiding Australian Areas

What do Geraldton, WA and Mackay in Queensland have in common? Well, apart from being remote coastal towns, they also appear surprisingly often in the Panama Papers – the leak of Panamanian firm Mossack Fonseca’s customer data.

The Panama Papers contain a wealth of fascinating revelations about Australians and their relationship with offshore tax havens. There are, of course, many legitimate reasons to retain a Panamanian law firm, and we are not implying any wrongdoing by the companies and individuals revealed in the documents.

There are 1409 Australian addresses listed in the Panama Papers, with state capitals featuring heavily.  There were only a handful of addresses in all of the ACT, SA, NT and Tasmania, so we’ll skip the top lists there.

NSW Top 10 Postcodes
Postcode Suburb Addresses
2000 Sydney CBD 51
2067 Chatswood 12
2065 St Leonards 9
2028 Double Bay 9
2121 Epping 9
2072 Gordon 9
2118 Carlingford 7
2220 Hurstville 7
2030 Vaucluse 7
2070 Lindfield 6

Sydney, 2000 is the nation’s most included postcode, being home to scores of legal and accounting firms. Notable for NSW though, is that the North Shore areas of Chatswood, St Leonards, Gordon and Lindfield are so highly represented, relative to only a few addresses in the affluent Eastern suburbs. Hurstville and Carlingford also make somewhat unexpected frequent appearances in the Mossack Fonseca customer database.

QLD Top 10 Postcodes
Postcode Suburb Addresses
4211 Nerang 21
4217 Surfers Paradise 13
4740 Mackay 10
4109 Sunnybank 9
4069 Brookfield 9
4227 Reedy Creek 8
4214 Arundel 8
4000 Brisbane 7
4113 Eight Mile Plains 7
4215 Southport 7


In QLD it’s the Gold Coast which dominates the top postcodes. Nerang, Surfers Paradise, Reedy Creek, Arundel, Eight Mile Plains and Southport fill the top postcodes. Sunnybank, Brookfield and Brisbane CBD are the Brisbane areas mentioned in the records, along with geographic outlier of Mackay appearing in 10 customer accounts.

Victoria Top 10 Postcodes
Postcode Suburb Addresses
3000 Melbourne 19
3186 Brighton 7
3142 Toorak 6
3122 Hawthorn 6
3004 Melbourne 6
3103 Balwyn 5
3079 Ivanhoe 4
3101 Kew 4
3124 Camberwell 4
3109 Doncaster 4


Victoria’s top suburbs are a more predictable tour of the inner east, from Ivanhoe down to Brighton, from Toorak across to Doncaster. Overall Victoria has fewer addresses than NSW or Queensland, with even WA showing more offshoring interest.


WA Top 10 Postcodes
Postcode Suburb Addresses
6530 Geraldton 15
6000 Perth 14
6005 Kings Park 9
6150 Bateman 8
6011 Cottesloe 8
6153 Applecross 7
6012 Mosman Park 7
6009 Nedlands 7
6008 Subiaco 6
6010 Swanbourne 6


WA’s surprise offshoring hotspot is Geraldton. The city is home to 15 residential addresses listed in the leak, which is more than Perth’s central 6000 postcode. Perth’s inner suburbs have a fairly even distribution of offshoring addresses after Geraldton.
The leaks are now fully searchable online at the IJIC Offshore Leaks website. The data can be viewed by suburb or even by street address.

We are now Microburbs!

After 6 months I’m pleased to announce that our real estate/suburb offering is moving out of its parent brand, NationMaster and out into the world with a new name, Microburbs. We’ll leave the international stats to NationMaster while we focus on Australian suburbs.

What are our Microburbs? They’re small areas typically of 200-800 people defined by demographic, economic, transport and geographic features.  The Australian Bureau of Statistics does great work drilling down into the population geography of Australia.  We draw on that analysis and many other sources to present a detailed view of neighbourhoods that we think is far more useful and relevant to householders than  the customary suburb view.  We still show you suburb level information, but we also show you the microburbs within.

Our mission is still the same – to give buyers all the information they need to decide whether to buy a property. But as we talked to home buyers and pored endlessly over our huge database, we had a realisation we need to share:

Suburbs are broken!

We’re not talking about a lack of public transport or amenities, or decline in community (though we’ll have plenty to say on these topics later). We’re talking about the very definition of suburbs – that they’re overused.

When people search for a property they tend to pick a suburb that fits their criteria, then look for properties in that suburb. This has two big problems:

The first is that suburbs are really diverse places, containing several distinct neighbourhoods, or microburbs.

Take the prestigious Hunters Hill in Sydney, known for its waterfront mansions and sandstone cottages, regularly starring on lists of the most affluent suburbs. Hunters Hill is actually 20 separate microburbs. One is a large public housing estate. One is a boys’ boarding school. Even after you exclude those, one has a median income of $989 per week, which is the average for Sydney. Another has a median income of $2,937.

(Median Incomes for Hunters Hill on Microburbs)

The second is that suburbs are big places, and the convenience of living in the lifestyle hub can be very different to living at the fringes.

If you’re out shopping in nearby Chatswood on a Sunday afternoon and need to be home in Hunters Hill on public transport by 3pm, you’ll really need to know your address. If you’re near the main road you can leave at 2:30. If you’re on the southern end it’s 1:30, because you’ll need an extra bus change, and an extra hour, to get there. And this an area that still has buses on a Sunday afternoon! In other suburbs, being in the wrong microburb means a long walk from public transport.

(http://www.transportnsw.info)

Microburbs.com.au is a fantastic tool for understanding your immediate locality: getting to know your neighbours without counting people a kilometre away who you’ll never meet. Lifestyle is about your street, your home, and where you can get to.

Type in any address in Australia here.