Owners on Lincoln Ave hold for 25 years. Edinburgh Rd median hold is 17.9 years. Half the suburb owns outright. The $4.9M median hides three distinct markets: harbour-edge prestige at $6M+, elevated interior at $4.5M, and Eastern Valley Way entry from $2.7M.
The $4.9M median tells you very little. Here is what each price band actually looks like, based on real sales.
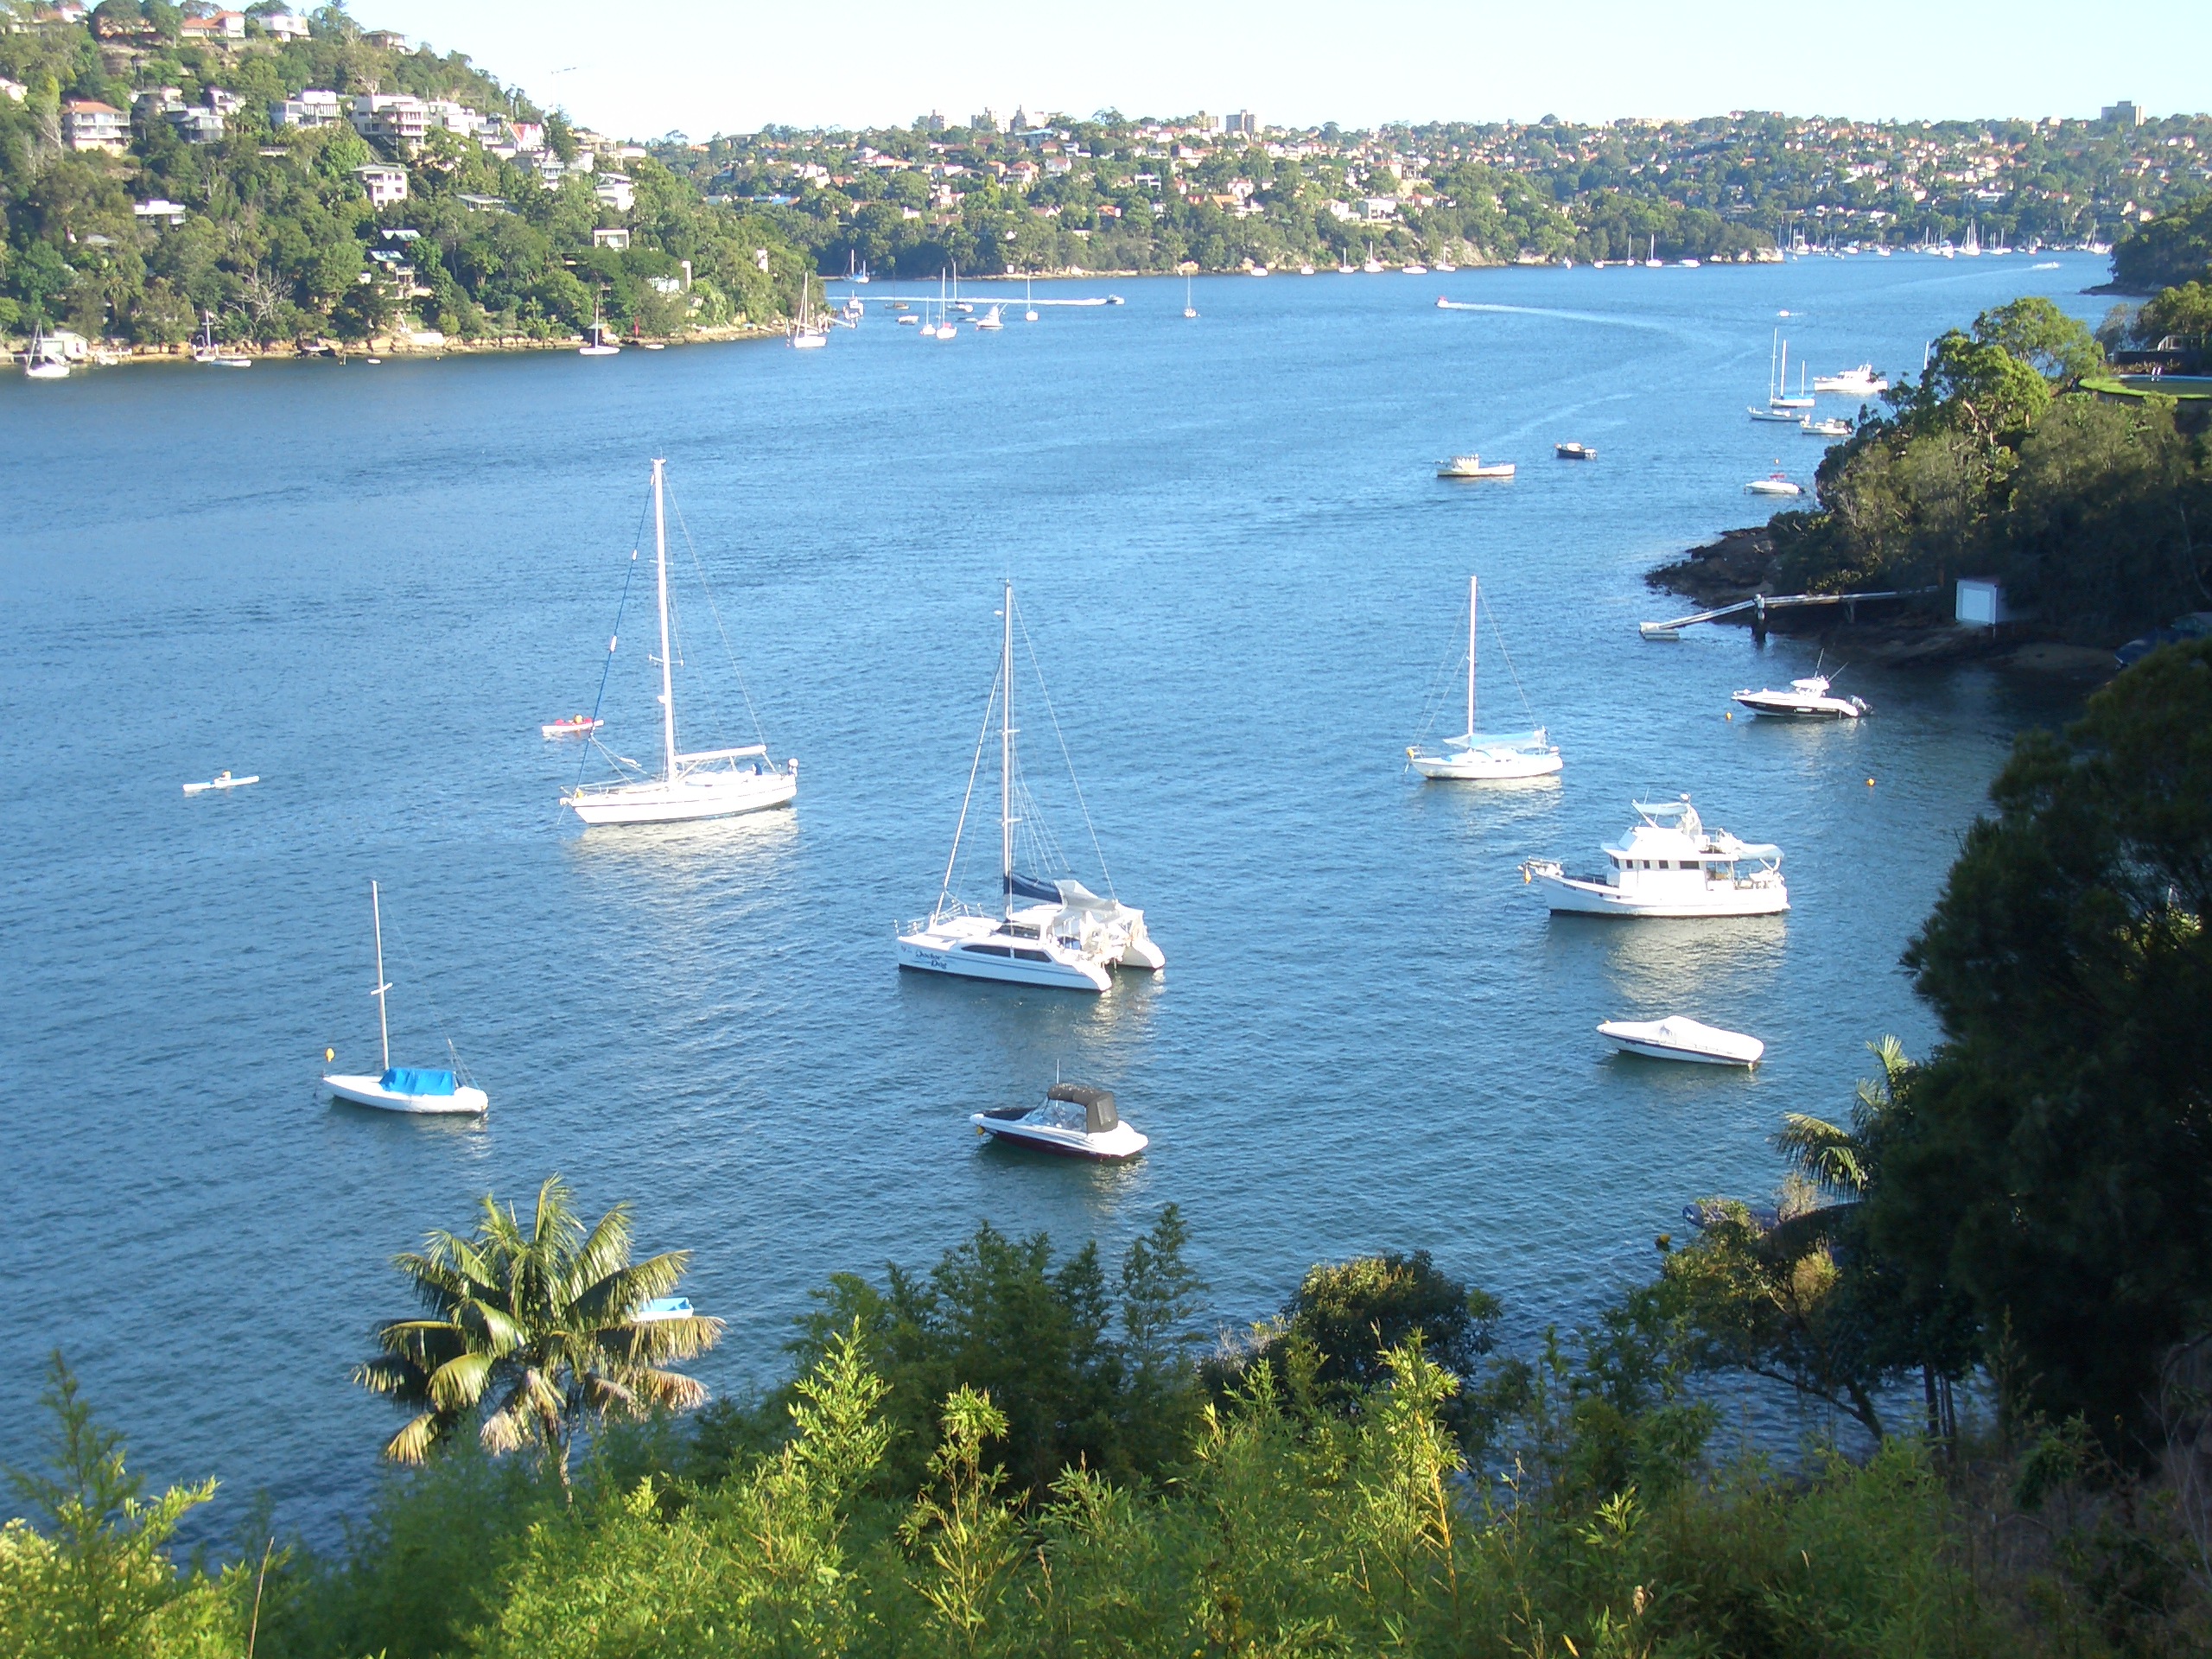
The suburb is bounded by Middle Harbour to the north, east, and south, and by Eastern Valley Way to the west. The castle-themed street names (The Battlement, The Rampart, The Citadel) sit on a peninsula jutting into Middle Harbour.
Water frontage or harbour views on the eastern peninsula. Median around $6.1M. 1 Cheyne Walk sold for $6.3M. 13 Cheyne Walk for $6.99M. Longest holds. Low flood risk (elevated). Low bushfire.
The castle-themed streets sit on the peninsula ridge. Median around $4.5M. Griffin-era stone homes, quiet cul-de-sacs. 32 The Scarp sold at $3.41M. Bushfire: moderate (adjacent to reserves).
The commercial corridor with village shops, bus routes. Median $4.9M but wide range ($2.3M to $13M). Highest turnover at 17.9 years. Most DAs concentrate here. Most renovation activity.
Traffic noise from the arterial. Median around $3.5M. Entry point to the suburb. Higher renter share. This is where the proposed 11-storey development sits. 121 Eastern Valley Way and nearby addresses are the most affordable blocks.
Current median house price by street, calculated from our property valuation model. Castlecrag has 32 streets with price data. Showing top 8 below.
| Street | Current Median | Beds | Land (sqm) | Total Sales | Median Hold | Trend |
|---|---|---|---|---|---|---|
| The Barbette | $9.14M | 4 | 735 | 58 | -- | |
| The Battlement | $6.84M | 4 | 735 | 58 | -- | |
| Sunnyside Cr | $5.55M | 4 | 594 | 145 | -- | |
| Lincoln Ave | $5.31M | 3 | 691 | 47 | 25.0 yrs | |
| The Bulwark | $4.96M | 4 | 708 | 216 | -- | |
| Linden Way | $4.73M | 4 | 772 | 66 | 13.7 yrs | |
| Edinburgh Rd | $4.61M | 4 | 717 | 306 | 17.9 yrs | |
| Charles St | $3.63M | 4 | 556 | 56 | -- |
+24 more streets available in the full Castlecrag report, including The Postern ($3.74M), Rutland Ave ($3.95M), Sugarloaf Cr ($4.53M), and all 32 streets with current medians, trends, and forecasts.
Lincoln Ave: only 47 sales in 20 years. This street almost never comes to market.
| Address | Sale Price | Our Valuation | vs Valuation | Bed/Bath/Gar | Land | Date |
|---|---|---|---|---|---|---|
| 148 Edinburgh Rd | $5,075,000 | $5,080,000 | ~match | 6/2/4 | 1,612sqm | Jan 2026 |
| 3 The Rampart | $2,936,000 | $2,940,000 | ~match | 5/3/2 | 556sqm | Mar 2023 |
| 18 The Barbette | $3,450,000 | $3,450,000 | ~match | --/--/-- | 805sqm | Mar 2023 |
| 35 Sunnyside Cr | $4,150,000 | $4,150,000 | ~match | 4/2/2 | 664sqm | Mar 2023 |
| 308 Edinburgh Rd | $13,000,000 | $13,000,000 | ~match | 6/4/4 | 1,360sqm | Dec 2022 |
| 58 Linden Way | $6,990,000 | $6,990,000 | ~match | 4/3/2 | 1,195sqm | Dec 2022 |
| 15 Charles St | $3,500,000 | $3,500,000 | ~match | 4/2/2 | 556sqm | Dec 2022 |
| 3 The Bulwark | $3,000,000 | $2,960,000 | Sold 1.4% above | 5/4/2 | 670sqm | Dec 2022 |
308 Edinburgh Rd at $13M is the highest sale in our records. 3 The Bulwark sold above our valuation range ($2.57M-$3.35M). More sales in the full report.
| Address | Guide | Our Valuation | Bed/Bath/Gar | Agent | Listed |
|---|---|---|---|---|---|
| 32 The Parapet | Guide $4,100,000 | $5.15M | 4/2/2 | McGrath Northbridge | 30 Jan 2026 |
| 21 Charles St | Auction | $3.63M | 5/4/3 | DiJones Willoughby | 6 Feb 2026 |
| 14 Sugarloaf Cr | Auction | $4.53M | 4/3/-- | Ray White LNS | 5 Feb 2026 |
| 12 Sunnyside Cr | Auction | $5.55M | 4/2/-- | McGrath Northbridge | 4 Feb 2026 |
| 70 Sugarloaf Cr | $3,400,000 | $4.53M | 5/3/-- | The Agency UNS | 29 Jan 2026 |
| 101 The Bulwark | Contact Agent | $4.96M | 5/4/-- | Ray White LNS | 29 Jan 2026 |
| 12 The Bulwark | Auction | $4.96M | 5/4/-- | Ray White LNS | 5 Feb 2026 |
| 4 Morotai Cr | POA | $5.55M | 5/3/-- | buymyplace | 23 Jan 2026 |
| 135 Eastern Valley Way | Auction | $4.65M | 4/2/-- | Ray White LNS | 29 Jan 2026 |
| 7 Knight Pl | Auction | $4.63M | 5/3/-- | DiJones Willoughby | 29 Jan 2026 |
10 properties listed Jan-Feb 2026. Blurred valuations are in the report ($49). 2 shown free as examples. Most listings are auction with no guide, so the valuation is the only way to estimate a likely range. See all Castlecrag properties.
| Address | Rent | Beds/Bath | Agent |
|---|---|---|---|
| 48 Sunnyside Cr | $1,950/wk | 5/3 | 888 Estate |
| 64 The Bulwark | $1,850/wk | 5/3 | R&W Northbridge |
| 6 The Postern | $1,500/wk | 5/2 | R&W Northbridge |
| 17 Cheyne Walk | $2,500/wk | 5/2 | LJH Castlecrag |
Rental yields in Castlecrag are structurally low (1.90%). The investor case is capital preservation, not cash flow. See rental yield by block in the full report. From $49.
| Metric | Castlecrag | Sydney |
|---|---|---|
| Median house | $4.9M | $1.47M |
| Days on market | 43 | 32 |
| Auction clearance | 68% | 65% |
| Sales volume (12m) | 34 | -- |
| Housing stock quality | 99.4 | -- |
| Metric | Castlecrag | Sydney |
|---|---|---|
| Median rent (house) | $1,940/wk | $650/wk |
| Gross yield | 1.90% | 2.4% |
| Renter share | 8.6% | 36% |
| Unit-to-house price ratio | 67.8% | 53% |
Unit-to-house price ratio: Castlecrag units cost 67.8% of house prices. This is a price comparison, not a count of dwellings. Units are proportionally more expensive here than the Sydney median, driven by downsizer demand for limited stock.
Red line = Sydney median (18%). Pool rate from 290 listings with features data (67 mention a pool). Still above median despite heritage constraints limiting pool approvals. Full amenity data in the report.
| Suburb | City | Pool % | 4+ Bed |
|---|---|---|---|
| Castlecrag | Sydney | 23% | 52% |
| Middle Cove | Sydney | 31% | 58% |
| Northbridge | Sydney | 26% | 48% |
| Willoughby East | Sydney | 15% | 35% |
Castlecrag was designed by Walter Burley Griffin in the 1920s as a community where homes would be "subservient to the setting." The Griffin Conservation Area protects 42 heritage sites. Median floor space ratio is just 0.29 (bottom 4% in Sydney). 24% of the suburb is environmental conservation area.
But the edges are being tested. In May 2025, developer Conquest purchased a corner site at Eastern Valley Way and Edinburgh Road and lodged an 11-storey proposal under the State Significant Development fast-track process. If approved, it would be the tallest building in Castlecrag by a factor of 4.
Recent DAs: lift installation at 335 Edinburgh Rd, deck and cabana at 148 Edinburgh Rd, demolition and new dwelling at 70 Linden Way. Most DAs are alterations, not new builds. Total DA count: 2,140 (top 2% in Sydney).
Castlecrag looks unaffordable. It is not, for the people who live there.
50% of residents own outright. Of the 42% with mortgages, repayments are about 24% of gross income, well below the 30% stress threshold. This suburb has strong vendor holding power in downturns.
The main risk is planning risk. The 11-storey proposal on Eastern Valley Way is the first serious challenge to the suburb's character in decades.
Castlecrag has zero identified social housing properties. We check every property individually using ownership records and tenancy data. In the full report, you can see social housing probability for individual addresses in any suburb. See Belmont North for an example suburb with social housing data.
| Suburb | City | Median House | DOM | Owner Occ. | Heritage | Median Hold |
|---|---|---|---|---|---|---|
| Castlecrag | Sydney | $4.9M | 43 | 90% | 42 | 18+ yrs |
| Northbridge | Sydney | $4.1M | 38 | 82% | 8 | 14 yrs |
| Middle Cove | Sydney | $3.8M | 35 | 88% | 2 | 15 yrs |
| Willoughby East | Sydney | $3.2M | 30 | 75% | 5 | 11 yrs |
| Willoughby | Sydney | $2.95M | 28 | 68% | 12 | 9 yrs |
Castlecrag is the most expensive and most tightly held of its neighbours. Northbridge offers similar prestige at $800K less. Middle Cove has larger lots with fewer heritage constraints. Willoughby is the value entry point at $2.95M. We model growth scenarios for every suburb. see how neighbours compare in the full report.
Every topic below has its own block-level analysis for Castlecrag. Click to see the full breakdown.
Compare Castlecrag to: Northbridge | Middle Cove | Willoughby East | Willoughby | Naremburn | Lane Cove | Chatswood
Or search any suburb to see block-level data.