Microburbs Research
The median mirage: why a suburb's median price lies to you
A suburb's median can rise for two very different reasons. Your home becomes worth more, or your neighbours knock theirs down and build mansions. Only one of those puts money in your pocket. We measured the difference across 13 million sales.

A stylised demonstration of how a median behaves. No individual home gains value at the moment the median jumps. Calibrated to the real finding: across Australia, about 38% of the reported median rise over 2018 to 2024 was the stock upgrading, not the same home gaining value.
What you just watched
The small brown shacks are ordinary old homes. As the years run, some are knocked down and rebuilt as large two-storey mansions. The strip on the top right lines all 25 homes up from cheapest to dearest, and the median is simply the middle home. While most of the street is still shacks, the middle home is a shack, so the reported median sits low. The moment more than half the street has been rebuilt, the middle home becomes a mansion, and the median leaps in a single step.
Watch the two lines on the chart. The orange average creeps up the whole time, because every rebuild lifts the average a little. The red median waits, then jumps. At the moment it jumps, no home gained value. The middle home is just a different home now. Your home is circled in gold. Its honest value is the green line, which rises gently with the land and never catches the median, because the median has stopped measuring homes like yours.
The founder put it best on a podcast
Microburbs founder Luke Metcalfe described this exact trap on The Elephant in the Room Property Podcast, in an episode titled "Why AI Can't Pick Property Winners".
About 30, 40% of all growth is just improvement in the home, and the property industry takes that credit. But of course that is no help to the average investor. Luke Metcalfe, The Elephant in the Room Property Podcast
Then came the analogy that sticks.
Everyone in your suburb drives a Datsun 180B, so the median price of a car is 50 bucks. Then everyone else goes and buys a Lamborghini. That does not mean your Datsun 180B is worth 200 grand. Luke Metcalfe, on why a rising median does not mean your home rose
Luke Metcalfe on The Elephant in the Room Property Podcast. The clip runs from the median problem through the Datsun and Lamborghini analogy to the case for resales.
We measured it across 13 million sales
We took every repeat sale in our data, the same property sold twice, and built a constant-quality growth index. That index follows homes that did not change, so it strips out rebuilds and renovations. Then we compared it to the reported median, which counts every sale including the shiny new builds.
Data as at June 2026. Constant-quality growth from 3.2 million reno-filtered repeat sales. Reported median from 13.3 million sales. Suburb comparisons use the fully settled 2016 to 2022 window, because 2023 to 2025 sales are still arriving and skew dear. The 2018 to 2024 window runs hot because recent sales skew to dearer stock, so treat it as the upper end. Over calmer, fully settled windows the national gap is smaller, roughly +1 to +2%/yr. The effect is largest in suburbs that are actively rebuilding, which is exactly where buyers chase the headline.
The suburbs where the median runs furthest ahead
These are large, liquid suburbs, each with thousands of repeat sales, so the numbers are not a small-sample fluke. In every row the reported median (2016 to 2022) outran the honest, same-home figure. The last column is the dollars an owner of the 2016 median home was told they made but did not.
| Suburb | Significant Urban Area | Reported median rise | Same-home rise | Share that is rebuilds | Phantom gap on the median home |
|---|---|---|---|---|---|
| Buderim | Sunshine Coast | +11.2%/yr | +5.5%/yr | 51% | $279,758 |
| Paradise Point | Gold Coast | +11.3%/yr | +5.3%/yr | 53% | $384,576 |
| Warrnambool | Warrnambool | +11.7%/yr | +5.6%/yr | 52% | $164,018 |
| Robina | Gold Coast | +8.8%/yr | +4.5%/yr | 49% | $199,687 |
| Orange | Orange | +13.0%/yr | +6.7%/yr | 48% | $189,429 |
| Maroochydore | Sunshine Coast | +10.2%/yr | +5.9%/yr | 41% | $155,808 |
| Rutherford | Newcastle | +10.8%/yr | +6.6%/yr | 39% | $129,891 |
| Surfers Paradise | Gold Coast | +5.2%/yr | +3.2%/yr | 38% | $61,560 |
| Werribee | Melbourne | +10.2%/yr | +6.7%/yr | 34% | $97,504 |
| Port Macquarie | Port Macquarie | +9.3%/yr | +6.2%/yr | 33% | $123,800 |
Read Buderim as: the reported median grew +11.2%/yr, but the same homes resold grew only +5.5%/yr, a gap of +5.7%/yr (2016 to 2022). More than half of the headline was better buildings, not capital growth.
See it on one chart
Here is Sunshine Coast's Maroochydore over sixteen years. The thick red line is the reported median sale price, and it races away after 2020. Each thin line is one real home that sold twice, drawn at the actual price it bought for and the actual price it later sold for. Nothing is rebased and nothing is pinned to the median, so every home sits exactly where it really traded. Hover any line for the address.
This is the honest version of the picture. The same homes, sold and sold again, spread out around the median rather than racing up with it. Green homes beat the median, blue homes grew slower. The headline median is the easy number to quote, but it averages two very different things: homes that barely changed, and homes that were rebuilt or renovated into something dearer. The chart cannot tell those apart. The before and after photos below can, and that is where the real story shows up.
Median from all Maroochydore house sales. Each line is a real repeat sale of one home, plotted at its actual buy and sale prices, with knock-down rebuilds removed so we are comparing the same house to itself. The gold bars show what share of sales were brand-new builds: it stays under one in ten, so most of the change in Maroochydore is not new estates but renovations and rebuilds of existing homes, which a new-build count alone cannot see. The before and after photos below show exactly that.
The homes on the chart
| The home | Bought | Sold | Actual growth |
|---|---|---|---|
| 6/3 Bradman Avenue | $535,000 2012 | $950,000 2022 | +5.6%/yr |
| 9/45 Dalton Drive | $280,500 2012 | $462,900 2020 | +5.9%/yr |
| 6 Saint Helena Street | $231,000 2012 | $622,000 2020 | +12.2%/yr |
| 69A Beach Parade | $360,000 2012 | $1,460,000 2021 | +16.5%/yr |
| 64/19 Arwen Street | $278,000 2012 | $540,000 2022 | +6.7%/yr |
| 68A School Road | $414,000 2012 | $475,000 2020 | +1.8%/yr |
| 3 Toombra Street | $415,000 2012 | $800,000 2023 | +6.6%/yr |
| 12 Kylee Crescent | $480,000 2012 | $560,000 2020 | +2.0%/yr |
| 84 School Road | $345,000 2013 | $749,000 2023 | +7.7%/yr |
| 7 Lisbon Street | $345,000 2013 | $581,000 2020 | +7.9%/yr |
| 26 Yorlambu Parade | $475,000 2013 | $1,370,000 2022 | +12.4%/yr |
| 9 Jalumba Street | $295,000 2013 | $477,000 2020 | +7.6%/yr |
| 1 Elizabeth Farm Court | $370,000 2013 | $495,000 2020 | +4.2%/yr |
| 6/4 Kirsten Court | $375,000 2013 | $620,000 2023 | +5.3%/yr |
| 3/5 Richards Street | $265,000 2013 | $351,000 2020 | +4.1%/yr |
| 19 Kowree Crescent | $512,000 2013 | $680,000 2020 | +4.3%/yr |
| 3 Tau Court | $485,000 2013 | $923,540 2021 | +8.8%/yr |
| 117 Millwell Road | $382,000 2013 | $850,000 2022 | +10.2%/yr |
| 4 Emperor Avenue | $365,000 2013 | $812,000 2024 | +8.0%/yr |
| 8 Pindari Street | $400,000 2014 | $757,000 2022 | +8.1%/yr |
| 12 Thomas Street | $430,000 2014 | $760,000 2021 | +8.2%/yr |
| 118 Millwell Road | $330,000 2014 | $695,000 2021 | +10.9%/yr |
| 26/6-8 Aerodrome Road | $398,000 2014 | $770,000 2021 | +10.0%/yr |
| 34 Forsayth Lane | $350,000 2014 | $1,230,000 2021 | +19.3%/yr |
| 126 Tepequar Drive | $510,000 2014 | $1,331,600 2020 | +18.5%/yr |
| 13 Amity Avenue | $280,000 2014 | $900,000 2021 | +19.6%/yr |
| 19 Pindari Street | $455,000 2014 | $1,000,000 2022 | +10.6%/yr |
| 2/106 Maroochy Waters Drive | $555,000 2014 | $1,160,000 2022 | +10.5%/yr |
| 4/12 Second Avenue | $350,000 2014 | $480,000 2021 | +4.8%/yr |
| 10/3 Highgate Place | $265,000 2014 | $395,000 2021 | +5.9%/yr |
| 12 Allambie Street | $450,000 2014 | $715,000 2020 | +8.1%/yr |
| 3 Blair Court | $454,000 2014 | $1,085,000 2024 | +9.8%/yr |
| 14/19 Arwen Street | $330,000 2015 | $395,000 2021 | +2.9%/yr |
| 9 Eliza Way | $217,500 2015 | $523,000 2020 | +18.2%/yr |
| 18 Forsayth Lane | $485,000 2015 | $689,000 2021 | +6.1%/yr |
| 8 Norman Avenue | $409,000 2015 | $875,000 2023 | +10.1%/yr |
| 10 Cooinda Crescent | $465,000 2015 | $660,000 2021 | +5.7%/yr |
| 53 Hinley Avenue | $430,000 2015 | $390,000 2020 | +-2.1%/yr |
| 502/92 Sixth Avenue | $640,000 2015 | $805,000 2022 | +3.3%/yr |
| 7 Gilbert Street | $417,000 2015 | $1,100,000 2022 | +14.6%/yr |
| 78 Maroochy Waters Drive | $945,000 2015 | $1,250,000 2020 | +6.3%/yr |
| 10 Easton Street | $395,000 2015 | $540,000 2020 | +6.8%/yr |
| 215 Main Road | $413,000 2015 | $750,000 2021 | +12.5%/yr |
| 7/12 Parker Street | $291,000 2016 | $325,000 2020 | +2.4%/yr |
| 12 Aragorn Street | $420,000 2016 | $960,000 2021 | +17.2%/yr |
| 1/12 Aragorn Street | $420,000 2016 | $960,000 2021 | +17.2%/yr |
| 35 Millwell Road | $501,000 2016 | $780,000 2020 | +9.8%/yr |
| 1/70-78 Alexandra Parade | $525,500 2016 | $1,070,000 2023 | +10.3%/yr |
| 81 Wrigley Street | $540,000 2016 | $820,000 2021 | +8.3%/yr |
| 48 Bungama Street | $500,000 2016 | $1,180,000 2024 | +11.8%/yr |
| 111 Millwell Road | $428,000 2016 | $650,000 2021 | +10.1%/yr |
| 96 Sunshine Cove Way | $669,000 2016 | $797,000 2020 | +4.3%/yr |
| 2/34 Yorlambu Parade | $615,000 2016 | $471,000 2021 | +-5.9%/yr |
| 55 Pepper Tree Circuit | $480,000 2017 | $860,000 2021 | +12.8%/yr |
| 191 Bradman Avenue | $725,000 2017 | $1,300,000 2023 | +9.9%/yr |
| 329 Bradman Avenue | $490,000 2017 | $550,000 2021 | +2.5%/yr |
| 7 Sunshine Court | $585,000 2017 | $1,185,000 2021 | +16.6%/yr |
| 9 Pepper Tree Circuit | $599,000 2017 | $895,000 2022 | +8.9%/yr |
| 3 Serenity Circuit | $600,000 2017 | $875,000 2024 | +5.4%/yr |
| 61/40-54 Primary School Court | $330,000 2017 | $505,000 2023 | +8.0%/yr |
| 18 Almaden Lane | $641,000 2017 | $1,025,000 2023 | +7.6%/yr |
| 27/19 Arwen Street | $315,000 2017 | $430,000 2022 | +6.8%/yr |
| 27 Turner Street | $480,000 2017 | $780,000 2023 | +8.8%/yr |
| 24/15 Dalby Street | $348,000 2017 | $650,000 2023 | +11.5%/yr |
| 76 Osborne Circuit | $670,000 2018 | $1,051,000 2024 | +7.4%/yr |
| 11 Meridien Drive | $812,000 2018 | $1,400,000 2023 | +10.8%/yr |
| 47 Mackenzie Drive | $695,000 2018 | $1,025,000 2024 | +6.9%/yr |
| 41/20 Beach Road | $560,500 2018 | $765,000 2023 | +7.0%/yr |
| 5 Alkira Street | $810,000 2018 | $1,335,000 2023 | +10.4%/yr |
| 54 Mackenzie Drive | $590,000 2018 | $925,000 2024 | +7.9%/yr |
Before and after: a lot of the growth is the home
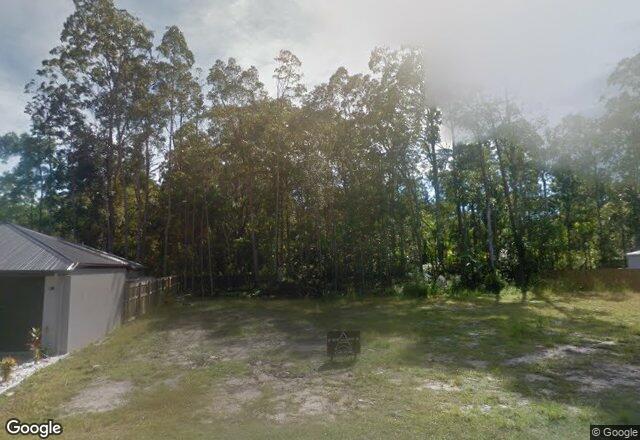
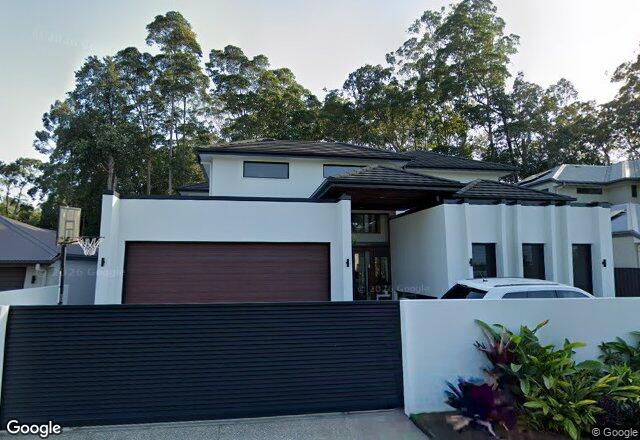
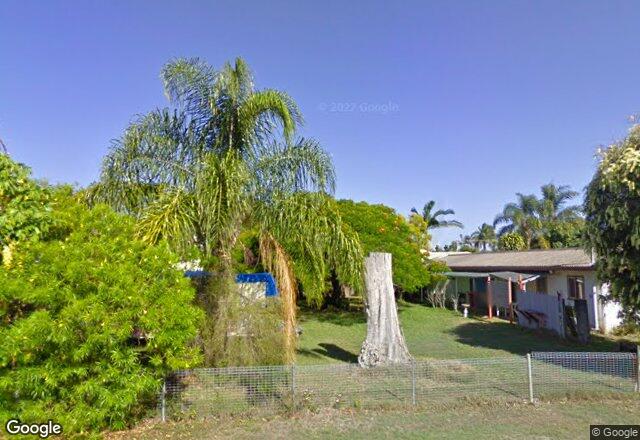
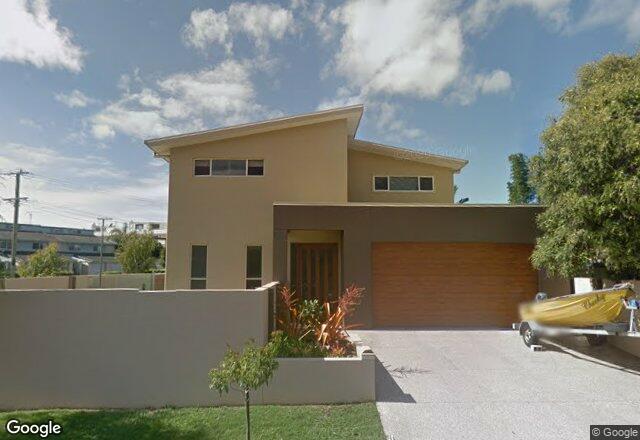
The chart treats every sale as one dot, but two sales at the same address can be two completely different buildings. Here are four homes from the suburbs above. Drag your eye from the left photo to the right one. The price went up, and so did the home. This is the part a median price can never show you, and it is a little like asking whether people are really getting more beautiful in their old photos. The answer is that the photo changed.
 BEFORE2014
 AFTER2023
 BEFORE2010
 AFTER2014
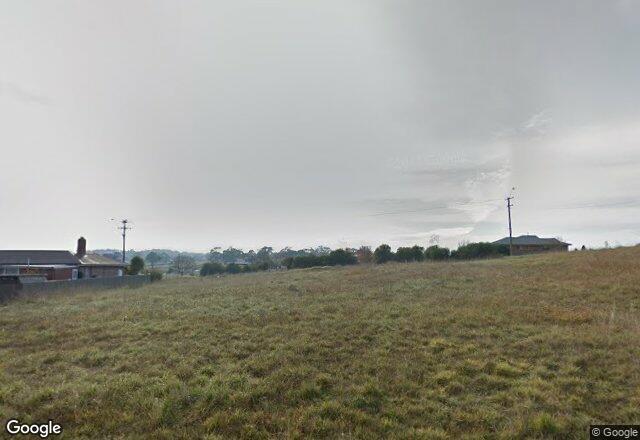 BEFORE2015
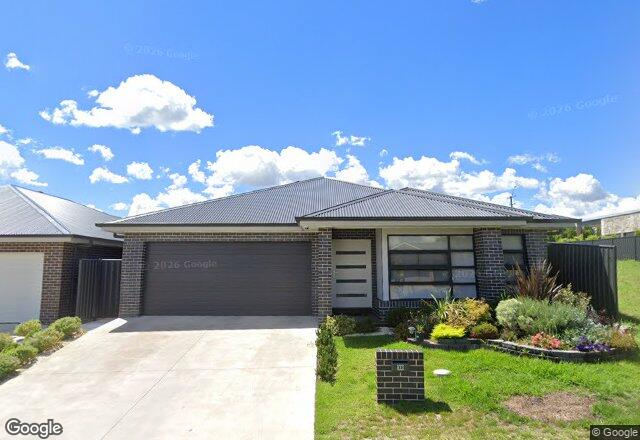 AFTER2026
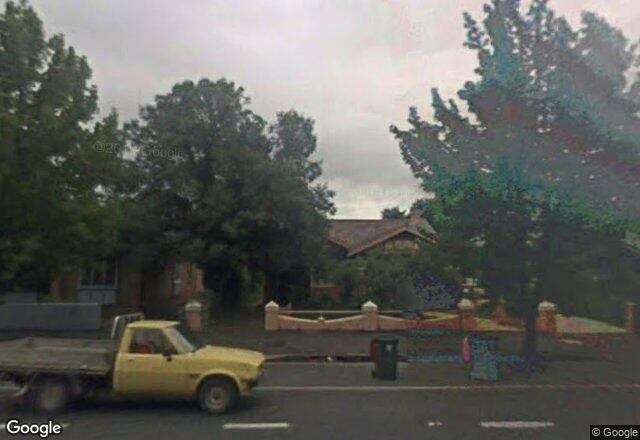 BEFORE2008
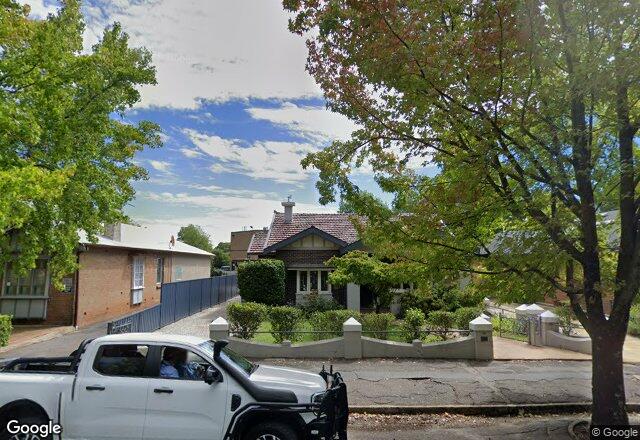 AFTER2026
Street View imagery, Google. Each pair was checked by hand to confirm the building actually changed. Prices are the recorded sales for that address. Not every home does this, which is why the same homes on the chart above spread out instead of all racing up. But when you compare a suburb's median today with its median ten years ago, you are partly comparing better homes with the ones they replaced.
The receipts: what the homes actually made
Talk is cheap, so here are the real sales. In each suburb below, a competitor headline said prices were racing away. Then we pulled every home that genuinely changed hands twice over those years, the same home both times, and listed what it actually made per year. Click any address to see its full history. The pattern is always the same. The typical home made a few points a year less than the headline, most never got close, and the handful that did had knocked the old house down and built a new one.
Over 2016 to 2022 the reported median rose +11.2%/yr ($545,000 to $1,033,500). CoreLogic still reports houses here at about +11% a year. But of the 538 homes that actually resold over those years without rebuilding, the median made +7.9%/yr. Only 23% got near the headline. Another 30 sales did beat it, but those were knock-down rebuilds, not the same home.
| The home (click for its report) | Bought | Sold | Actual growth |
|---|---|---|---|
| 74 William Street | $850,000 2016 | $1,300,000 2023 | +5.7%/yr |
| 7 Barleycorn Avenue | $1,625,000 2015 | $2,550,000 2022 | +6.8%/yr |
| 64 Nyes Crescent | $545,000 2016 | $925,000 2023 | +7.5%/yr |
| 12 Dawes Drive | $540,000 2016 | $880,000 2022 | +8.2%/yr |
| 14 Sam White Drive | $385,000 2014 | $755,000 2022 | +8.8%/yr |
| 90 Deloraine Drive | $498,000 2015 | $1,030,000 2023 | +9.6%/yr |
| 9/38-42 King Street | $348,000 2017 | $655,000 2023 | +10.3%/yr |
Over 2016 to 2022 the reported median rose +13.0%/yr ($315,000 to $655,000). CoreLogic still reports houses here at about +7% a year. But of the 364 homes that actually resold over those years without rebuilding, the median made +10.5%/yr. Only 27% got near the headline. Another 24 sales did beat it, but those were knock-down rebuilds, not the same home.
| The home (click for its report) | Bought | Sold | Actual growth |
|---|---|---|---|
| 63-65 Peisley Street | $380,000 2017 | $345,000 2023 | +-1.7%/yr |
| 27 Olympic Drive | $447,000 2014 | $820,000 2022 | +7.3%/yr |
| 23 George Weily Place | $500,000 2015 | $860,000 2021 | +8.6%/yr |
| 6 Torpy Street | $340,000 2016 | $662,500 2023 | +9.3%/yr |
| 113 Molong Road | $320,000 2014 | $670,000 2022 | +10.0%/yr |
| 238 Mclachlan Street | $280,000 2016 | $455,000 2021 | +10.5%/yr |
| 10 Victoria Street | $390,000 2016 | $720,000 2022 | +11.1%/yr |
Over 2016 to 2022 the reported median rose +8.8%/yr ($558,000 to $925,000). CoreLogic still reports houses here at about +10% a year. But of the 448 homes that actually resold over those years without rebuilding, the median made +6.9%/yr. Only 36% got near the headline. Another 7 sales did beat it, but those were knock-down rebuilds, not the same home.
| The home (click for its report) | Bought | Sold | Actual growth |
|---|---|---|---|
| 112/22-24 Ben Lexcen Place | $649,000 2014 | $640,000 2021 | +-0.2%/yr |
| 103 North Hill Drive | $442,500 2015 | $549,000 2021 | +3.8%/yr |
| 2/15 Dandenong Terrace | $492,500 2014 | $750,000 2021 | +5.7%/yr |
| 3 Macedon Close | $450,000 2014 | $680,000 2021 | +6.7%/yr |
| 4 Novar Court | $450,000 2014 | $875,000 2023 | +7.6%/yr |
| 3 Sawgrass Place | $680,000 2017 | $960,000 2021 | +8.3%/yr |
| 18 Fan Road | $520,000 2014 | $970,000 2021 | +8.9%/yr |
Over 2016 to 2022 the reported median rose +10.2%/yr ($420,000 to $750,000). CoreLogic still reports houses here at about +19% a year. But of the 451 homes that actually resold over those years without rebuilding, the median made +8.6%/yr. Only 36% got near the headline. Another 74 sales did beat it, but those were knock-down rebuilds, not the same home.
| The home (click for its report) | Bought | Sold | Actual growth |
|---|---|---|---|
| 9 Cooinda Crescent | $550,000 2015 | $760,000 2021 | +5.4%/yr |
| 75 Sugar Road | $460,000 2015 | $650,000 2021 | +6.8%/yr |
| 3/12 Blanck Street | $290,000 2015 | $460,000 2021 | +7.5%/yr |
| 21 Hilltop Crescent | $530,000 2017 | $820,000 2023 | +8.1%/yr |
| 128/19 Arwen Street | $320,000 2017 | $540,000 2023 | +8.7%/yr |
| 16 Kowree Crescent | $455,000 2015 | $845,000 2022 | +9.4%/yr |
| 111 Millwell Road | $428,000 2016 | $650,000 2021 | +10.1%/yr |
Over 2016 to 2022 the reported median rose +11.7%/yr ($293,000 to $570,000). CoreLogic still reports houses here at about +8% a year. But of the 295 homes that actually resold over those years without rebuilding, the median made +8.7%/yr. Only 22% got near the headline. Another 11 sales did beat it, but those were knock-down rebuilds, not the same home.
| The home (click for its report) | Bought | Sold | Actual growth |
|---|---|---|---|
| 9 Penfold Drive | $416,000 2016 | $530,000 2021 | +5.7%/yr |
| 20 Wando Street | $435,000 2015 | $650,000 2021 | +6.5%/yr |
| 35 Huntingfield Drive | $365,000 2017 | $500,000 2021 | +7.3%/yr |
| 42 Barkly Street | $345,000 2017 | $565,000 2023 | +7.9%/yr |
| 59 Skene Street | $354,000 2016 | $600,000 2022 | +8.4%/yr |
| 133 Mortlake Road | $325,000 2015 | $610,000 2022 | +8.9%/yr |
| 52 Hopetoun Road | $292,000 2017 | $525,000 2023 | +9.8%/yr |
Over 2016 to 2022 the reported median rose +10.8%/yr ($339,000 to $627,000). CoreLogic still reports houses here at about +13% a year. But of the 200 homes that actually resold over those years without rebuilding, the median made +9.2%/yr. Only 34% got near the headline. Another 6 sales did beat it, but those were knock-down rebuilds, not the same home.
| The home (click for its report) | Bought | Sold | Actual growth |
|---|---|---|---|
| 3 Diamond Circuit | $435,000 2014 | $450,000 2021 | +0.5%/yr |
| 8 Adam Avenue | $560,000 2016 | $790,000 2021 | +6.5%/yr |
| 31 Broughton Street | $355,000 2016 | $520,000 2021 | +7.3%/yr |
| 12 Brittany Avenue | $416,000 2016 | $750,000 2023 | +8.0%/yr |
| 48 Brigantine Street | $380,000 2014 | $730,000 2022 | +8.9%/yr |
| 3 Opal Street | $360,000 2016 | $620,000 2022 | +9.2%/yr |
| 18 Wolstenholme Street | $290,000 2015 | $533,200 2021 | +9.8%/yr |
Headline growth from CoreLogic suburb house data (12 months to 2026, via yourinvestmentpropertymag.com.au) and from our own reported-median series (2016 to 2022). Actual growth is the real annual rate between two arms-length sales of the same property, with knock-down rebuilds and part-sales removed.
The trapped investor
Take Paradise Point on the Gold Coast. The reported median rose +11.3%/yr from 2016 to 2022. The same homes, resold unchanged, rose only +5.3%/yr. So a buyer who paid the 2016 median of $715,000 and simply kept the home would hold about $975,000 by 2022. The reported median says $1,360,000. That $385,000 difference is a mirage. It is the rebuilds next door, and this owner cannot sell their unchanged home for it.
It shows up in real sales. The home at 60 King Charles Drive, Paradise Point was bought for $2,400,000 and sold a little over six years later for $2,700,000, a return of +1.9%/yr. Over the same years the suburb's reported median implied this home should be worth more than $4.7 million. The owner held an unchanged house in a suburb full of rebuilds. The median promised a number the house could never fetch.
Why your data provider does not warn you
It is easy to spot a suburb that is busy rebuilding. Sales volumes lift, building approvals climb, and the median creeps up. It is much harder to predict the future value of the land underneath, which is the part you actually own and actually keep. Many tools lean toward the easy signal.
Most exposed
Raw suburb medians on the major portals and from state valuers, plus momentum scouts that rank suburbs on sales counts, days on market and building approvals. A rebuild wave lights up every one of those signals, so they ride the building trend and report it as growth.
More robust
CoreLogic's hedonic index and PropTrack's repeat-sales index both try to hold quality constant, so they strip out much of this effect. We say so plainly. The residual catch is that they control for the rooms they can see, not for an interior renovation or a teardown sold as new.
So the honest split is simple. Constant-quality indices try to strip the building out. Raw medians and momentum scores do not. If your growth number is a raw median, a large slice of it may be other people's construction.
How Microburbs measures it
Our suburb prices use a smart median, a quality-adjusted figure that prices the median property, not the median sale. When upper-tier and brand-new stock floods the market, a raw median lurches up. The smart median holds the mix steady. It also removes the value that came from money poured in. A home that sells for $300,000 more after a $150,000 renovation shows $150,000 of true growth, not $300,000.
Underneath it all we lean on resales. The same property, sold twice, is the cleanest read on what land and location did, because the house is roughly the same house. As Luke says, we increasingly try to do our research looking at resales, not median values.
What to do with this
Before you trust a suburb's growth figure, ask one question. Is this the same homes getting dearer, or different homes getting built. If a suburb is full of cranes and knock-downs, treat the headline median as a story about builders, not about your block. Look at the resales. Look at the land. That is the number you can actually sell.